
Workforce Drug Test Positivity Climbs to Highest Level in 2 Decades
On Mar 30, 2022The rate of positive drug test results among America’s workforce reached its highest rate last year since 2001 and was up more than 30% in the combined U.S. workforce from an all-time low in 2010-2012, according to a new analysis released today by Secaucus-based Quest Diagnostics.
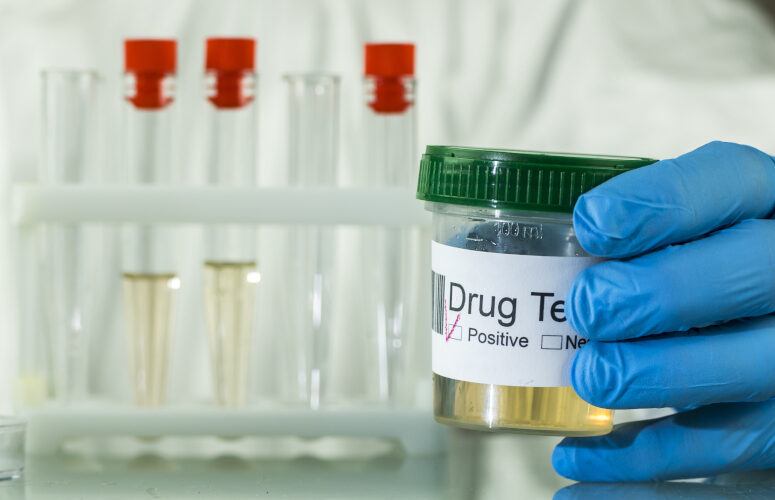
The study, based on more than 11 million de-identified urine, hair and oral fluid drug test results collected between January and December 2021, offers revealing insights into workforce drug use as employers grapple with creating safe, healthful work environments amid an ongoing recruitment and retention crisis.
The overall positivity rate in the combined U.S. workforce, based on nearly nine million urine drug tests collected between January and December 2021, was up in 2021 to 4.6% compared to 4.4% in 2020 and up 31.4% from the all-time low of 3.5% just 10 years ago (2010-2012).
The combined U.S. workforce includes the general U.S. workforce of mostly company-policy testing by private employers as well as the federally mandated, safety-sensitive workforce, which includes federal employees and the transportation and nuclear power industries, and can include workers such as pilots, truck drivers, train conductors and others required to drug test under federal legislation.
Overall positivity in the federally mandated, safety-sensitive workforce based on nearly 2.7 million urine drug tests stayed even year over year (2.2% in 2020 and 2021) and was 4.8% higher than 2017 (2.1% in 2017 versus 2.2% in 2021). In the general U.S. workforce, positivity increased 1.8% (5.5% in 2020 versus 5.6% in 2021) and was 12% higher than in 2017 (5.0% in 2017 versus 5.6% in 2021) and up each of the last five years.
“Our Drug Testing Index reveals several notable trends, such as increased drug positivity rates in the safety-sensitive workforce, including those performing public safety and national security jobs, as well as higher rates of positivity in individuals tested after on-the-job accidents,” said Barry Sample, PhD, senior science consultant for Quest Diagnostics.
“Employers are wrestling with significant recruitment and retention challenges as well as with maintaining safe and engaging work environments that foster positive mental and physical wellbeing,” said Keith Ward, general manager and vice president, Quest Diagnostics Employer Solutions. “Our Drug Testing Index data raises important questions about what it means to be an employer committed to employee health and safety. Eager to attract talent, employers may be tempted to lower their standards. In the process, they raise the specter of more drug-related impairment and worksite accidents that put other employees and the general public in harms’ way.”
Despite years of decline, positivity rates increased in several federally mandated, safety-sensitive workforce testing categories
After five years of steady declines in several drug categories, positivity rates based on urine drug tests for the federally mandated, safety-sensitive workforce increased in 2021. Of note, marijuana increased 8.9% (0.79% in 2020 to 0.86% in 2021), amphetamines increased 7.8% (0.64% in 2020 to 0.69% in 2021) and cocaine increased 5.0% (0.20% in 2020 to 0.21% in 2021).
“It is important for workers to know that certain employers are required to test for marijuana under federal law and if they use marijuana, they can still lose their jobs,” said Dr. Sample. “People who use drugs during working hours or before work can still be impaired and dangerous to co-workers, the general public and themselves.”
Positivity for marijuana continues upward climb in general U.S. workforce
Positivity rates for marijuana in the general U.S. workforce, based on more than 6 million urine tests, continued an upward climb, increasing 8.3% (3.6% in 2020 versus 3.9% in 2021), the highest positivity rate ever reported in the DTI. Over five years, positivity for marijuana in the general U.S. workforce increased 50% (2.6% in 2017 versus 3.9% in 2021).
In oral fluid testing, overall workforce drug positivity decreased, but increased for marijuana, methamphetamine and cocaine
In 2021, positivity in the general U.S. workforce based on oral fluid was 7.3% in 2021, a decline of 46.3% compared to 2020 (13.6%) and 29.8% compared to 2017 (10.4%). The drop in oral fluid-positivity (13.6% in 2020 versus 7.3% in 2021) was driven by a decline in the number of pre-employment tests that included marijuana. However, for those tests that included marijuana, the oral-fluid drug positivity rate for marijuana was 14.8% in 2021, an increase of 20.3% compared to 2020 (12.3%) and up 68.2% over five years (8.8% in 2017). At the same time, the positivity rate for cocaine increased 46.6% (0.58% in 2020 versus 0.85% in 2021), its highest spike since 2006, and methamphetamine increased 26.4% (0.53% in 2020 versus 0.67% in 2021), exhibiting year-over-year increases for the last 5 years.
Oral fluid tests generally have a shorter window of drug detection than urine, and can detect some drugs faster, in a matter of minutes versus hours. Oral fluid collection also has the advantage of being observed, making it harder to subvert the testing process.
Mixed picture for cocaine positivity in the general U.S. workforce
Positivity for cocaine based on urine tests in the general U.S. workforce decreased 4.5% (0.22% in 2020 versus 0.21% in 2021) and positivity for cocaine over the past five years declined 30% (0.30% in 2017 versus 0.21% in 2021). Positivity rates for cocaine based on urine tests in the federally mandated safety, safety-sensitive workforce increased 5.0% (0.20% in 2020 versus 0.21% in 2021), the first increase in five years.
Positivity for opiates and oxycodones in the general U.S. workforce decreased last year and over five years
Positivity for opiates (codeine/morphine) based on urine drug tests in the general U.S. workforce decreased 19% (0.21% in 2020 versus 0.17% in 2021) and 56.4% over five years (0.39% in 2017 versus 0.17% in 2021). Positivity for opiates (hydrocodone/hydromorphone) in the general U.S. workforce decreased 3% (0.33% in 2020 versus 0.32% in 2021) and 37.3% over five years (0.51% in 2017 versus 0.32% in 2021). Positivity for oxycodones (oxycodone/oxymorphone) in the general U.S. workforce stayed the same in 2020 and 2021 (0.29%) and decreased 52.5% over five years (0.61% in 2017 versus 0.29% in 2021). To see a U.S. map depicting positivity rates for different classes of opiates and oxycodone, visit DTIDrugMap.com.
Positivity for 6-AM (heroin) in the general U.S. workforce decreased over five years
Positivity for 6-AM metabolite (heroin) based on urine tests in the general U.S. workforce decreased 27.8% (0.018% in 2020 versus 0.013% in 2021) and 56.7% over five years (0.03% in 2017 versus 0.013% in 2021). Positivity for the 6-AM metabolite (heroin) in the federally mandated, safety-sensitive workforce decreased 37.5% (0.008% in 2020 versus 0.005% in 2021) and 73.7% over five years (0.019% in 2017 versus 0.005% in 2021).
To access more business news, visit NJB News Now.
Related Articles:

- Accounting
- Banking / Financial
- Coronavirus
- Diversity
- Economic Development
- Economy
- Energy
- Environment
- General Business
- Government
- Healthcare
- High-Tech
- Higher Ed
- Infrastructure
- Labor
- Law
- Life Sciences
- Manufacturing
- Meeting Places
- New Hire/Promotion
- Philanthropy
- Real Estate
- Science & Technology
- Small Business
- Tourism
- Workforce Development
- Special Sections
- Sponsored Content
