

U.S. Labor Market Shows Signs of Slowing in Q3 2019
On Oct 24, 2019Wages for U.S. workers grew 3.2 percent over the last year, increasing the average wage level by $0.90 to $28.71 an hour, according to the ADP Research Institute Workforce Vitality Report (WVR). The wage growth of 3.2 percent corresponds to the BLS numbers of 2.9 percent which was released earlier this month, October 2019.
Chart 1: Yearly Wage & Employment Growth – September 2019
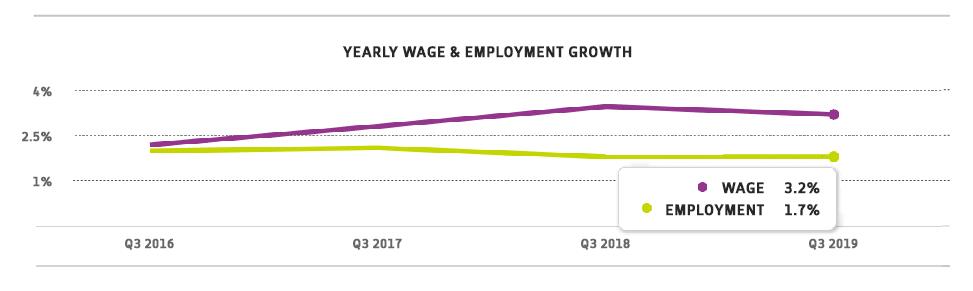
Yearly U.S. wage and employment growth according to the ADP Workforce Vitality Report by the ADP Research Institute.
“The labor market has shown signs of a slowdown. After accelerating at the start of 2019, annual employment growth has leveled off to a modest 1.7 percent in September,” said Ahu Yildirmaz, co-head of the ADP Research Institute. “While job switchers continue to enjoy wage growth of 5.1 percent, employers appear to have reached the limit of what they are willing to pay workers to entice them to switch jobs.”
Chart 2: Wage Growth for Job Switchers* – September 2019
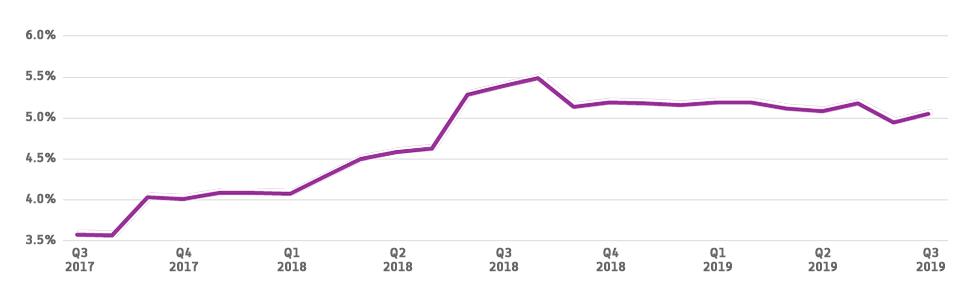
*12-month moving average of wage growth rate
Job switchers receive an average wage increase of 5.1 percent when they moved to a new employer. Wage growth for job switchers varies significantly across industries (ranging between -3 percent to 10 percent). Construction, Finance, Information, some parts of the Professional Services industry are still outperforming the overall average.
Table 1: Wage and Employment Growth by Industry – September 2019
| Industry | Wages | YOY Wage Growth | Yearly Growth | ||||
| All | Holders | Entrants | Switchers | Employment Growth | Switching Rate | ||
| -ALL- | $28.71 | 3.2% | 4.8% | 5.5% | 5.1% | 1.7% | 20.8% |
| Goods | |||||||
| Construction | $28.90 | 3.7% | 5.1% | 2.3% | 8.3% | 4.7% | 15.9% |
| Manufacturing | $30.11 | 4.0% | 5.0% | 2.9% | 5.2% | 0.6% | 18.6% |
| Resources and Mining | $34.18 | -2.7% | 4.5% | 5.2% | 2.9% | -0.3% | 10.8% |
| Services | |||||||
| Information | $41.92 | 2.7% | 5.4% | -5.4% | 10.2% | 1.6% | 18.1% |
| Finance and Real Estate | $33.68 | 3.3% | 4.8% | 9.4% | 6.0% | 1.2% | 18.3% |
| Professional and Business Services | $36.55 | 3.8% | 4.6% | 5.0% | 7.9% | 2.1% | 24.6% |
| Education and Health Services | $27.21 | 2.3% | 4.1% | 4.6% | 3.2% | 2.6% | 19.6% |
| Leisure and Hospitality | $17.73 | 3.9% | 5.5% | 6.5% | -3.3% | 2.4% | 24.6% |
| Trade, Transportation, and Utilities | $25.43 | 3.5% | 5.1% | 7.9% | 3.9% | 0.5% | 21.3% |
Workers in the Midwest outpaced other regions with 3.9 percent wage growth although the hourly wage rate was the lowest at $26.76. This region also experienced the lowest employment growth at 0.9 percent. Job switchers fared best in the West experiencing a wage growth of 6.6 percent. The workers in the South had the lowest wage growth at 2.9 percent. By firm size, workers at large firms had the highest wage growth rate at 4.1 percent, with employment growth at 3.2 percent.
Table 2: Wage and Employment Growth by Region and Firm Size – September 2019
| Region | Wages | YOY Wage Growth | Yearly Growth | ||||
| All | Holders | Entrants | Switchers | Employment Growth | Switching Rate | ||
| -USA- | $28.71 | 3.2% | 4.8% | 5.5% | 5.1% | 1.7% | 20.8% |
| MIDWEST | $26.76 | 3.9% | 4.6% | 4.7% | 4.2% | 0.9% | 19.7% |
| NORTHEAST | $32.21 | 3.1% | 4.8% | 6.1% | 5.6% | 1.5% | 22.1% |
| SOUTH | $26.84 | 2.9% | 4.6% | 4.5% | 4.4% | 1.9% | 20.7% |
| WEST | $30.83 | 3.2% | 5.2% | 7.2% | 6.6% | 2.4% | 21.1% |
| Company Size | |||||||
| -ALL- | $28.71 | 3.2% | 4.8% | 5.5% | 5.1% | 1.7% | 20.8% |
| 49 or less | $26.25 | 2.7% | 4.1% | 4.1% | 3.5% | 0.4% | 14.9% |
| 50 to 499 | $28.78 | 2.5% | 4.8% | 5.2% | 5.0% | 0.5% | 23.0% |
| 500 to 999 | $29.67 | 2.1% | 5.1% | 4.9% | 5.1% | 3.2% | 21.4% |
| 1000 or more | $29.99 | 4.1% | 5.0% | 6.8% | 5.5% | 3.2% | 23.5% |
To access more business news, visit NJB News Now.
Related Articles:


- Accounting
- Banking / Financial
- Coronavirus
- Diversity
- Economic Development
- Economy
- Energy
- Environment
- General Business
- Government
- Healthcare
- High-Tech
- Higher Ed
- Infrastructure
- Labor
- Law
- Life Sciences
- Manufacturing
- Meeting Places
- New Hire/Promotion
- Philanthropy
- Real Estate
- Science & Technology
- Small Business
- Tourism
- Workforce Development
- Special Sections
- Sponsored Content
