Rutgers Economist: Atlantic City’s Decline Hurts NJ’s Economic Recovery
On Dec 16, 2014The closures of four Atlantic City casinos and the likely shuttering of a fifth will cost New Jersey 11,000 direct jobs this year. The result: the lowest annual job growth in the state since 2011 “What is key here is that New Jersey has been so underperforming the nation. The jobs recovery is a nonevent,” said Nancy Mantell, director of the Rutgers Economic Advisory Service (R/ECON). She gave her forecast at R/ECON’s semiannual subscriber conference today.
The state has recovered less than half of the 257,900 jobs lost during the Great Recession from January 2008 to January 2011. At this rate, the state’s job base won’t return to its peak level of 4.09 million jobs until mid-2017. In the last year – from October 2013 to October 2014 – the state has added 9,200 jobs, and is expected to add 11,500 overall in 2014.
By comparison, the national economy had, by May 2014, recovered its full recessionary job loss and is now 1.2 percent above its previous peak. “The divide between growth in New Jersey and the U.S. economy is continuing to expand,” said Mantell. She added that the casinos’ demise has dragged down state’s growth overall this year.
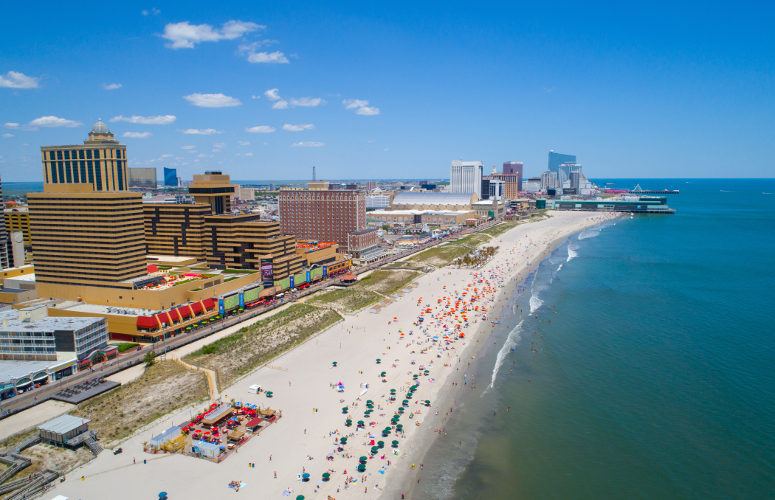
When the Atlantic Club went out of business in January, followed by the Showboat at the end of August and Revel and Trump Plaza in September, 8,000 workers lost their jobs. With the expected closing of the Taj Mahal before year’s end, another 3,000 workers will be without paychecks, Mantell said. “That’s more than a third of the jobs in the sector in January 2014, and more than 8 percent of jobs in Atlantic City.
“Even if you expand gambling into the Meadowlands, I’m not sure that is the answer,” she continued. “Apparently casinos in Connecticut are having problems, and of course, we have competition from casinos in New York and Pennsylvania. Cities and states get a little boost from construction jobs, but then what?”
Although New Jersey’s unemployment rate has fallen substantially in the past year, it is still higher than the nation’s and will remain slightly higher through next year, an estimated 6 percent compared with 5.8 percent. While Mantell finds the height of the rate a concern, she says the real problem is that the unemployment figure has fallen primarily because people have stopped considering themselves to be part of the labor force. She points to the decline in the labor force participation rate from 67 percent in 2009 to a current average of less than 64 percent.
Partly because of the gaming industry implosion, Mantell expects a small 0.3 percent gain in nonagricultural employment this year followed by an increase of 1.4 percent in 2015. Through the end of the forecast period in 2024, Mantell predicts an average annual increase in jobs of only 0.8 percent.
By the end of the forecast in 2014, the employment base will be an estimated 205,000 jobs greater than its level at the peak.
To date, during the state’s sluggish recovery, all job gains have been in the private sector; there has been a 4.6 percent increase since the sector’s trough in February 2010. New Jersey’s public sector employment has declined 7.5 percent since its May 2010 peak. According to Mantell, the professional and business services and education and health services sectors continue to play vital roles in New Jersey’s comeback and now account for 46 percent of the state’s jobs, although they account for only 41 percent of wages and 29 percent of output.
New Jerseyans’ personal income, which grew 2.3 percent in 2013, is predicted to rise 2.8 percent this year and 4.2 percent the next. From 2013 to 2024, the anticipated rise will be an average rate of 4.3 percent, somewhat slower than the 4.8 percent annual growth rate expected for the U.S. over the decade.
R/ECON, part of the Center for Urban Policy Research at Rutgers’ Edward J. Bloustein School of Planning and Public Policy, provides private-sector and government entities with a comprehensive set of tools for analyzing the New Jersey economy.
SUMMARY OF NEW JERSEY ECONOMIC FORECAST
2013 2014 2015 2015-24
Annual Percentage Change
Nonagricultural
Employment 1.2% 0.3% 1.4% 0.8%
Real Gross State Product 1.1% 1.1% 3.0% 2.2%
Personal Income 2.3% 2.8% 4.2% 4.4%
Population 0.4% 0.4% 0.6% 0.7%
Consumer Prices 1.4% 1.5% 1.2% 2.2%
Percentage
Unemployment rate 8.2% 6.7% 6.0% 5.4%
(average)
Related Articles:


